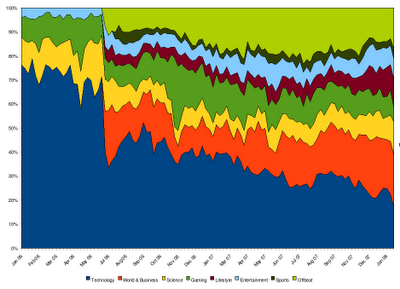
There was a story on Mashable today about the number of tech stories on Digg dropping, though the method they used was by looking at wayback machine results. However since Digg have all this information available in their API, we can get a much more accurate picture of what has happened. So here is a graph of the percentage of stories in each 'Container'. Each data point is for a full week of stories, so this should cover every story since the 1st of January 2006 until the 3rd of February 2008. (click on the image to view it full size)
